State of in-app subscriptions 2025
The most comprehensive report on mobile subscription growth, based on $1.9B in revenue from 11,000+ apps. Learn how to price, monetize, and scale faster in 2025.
Download the report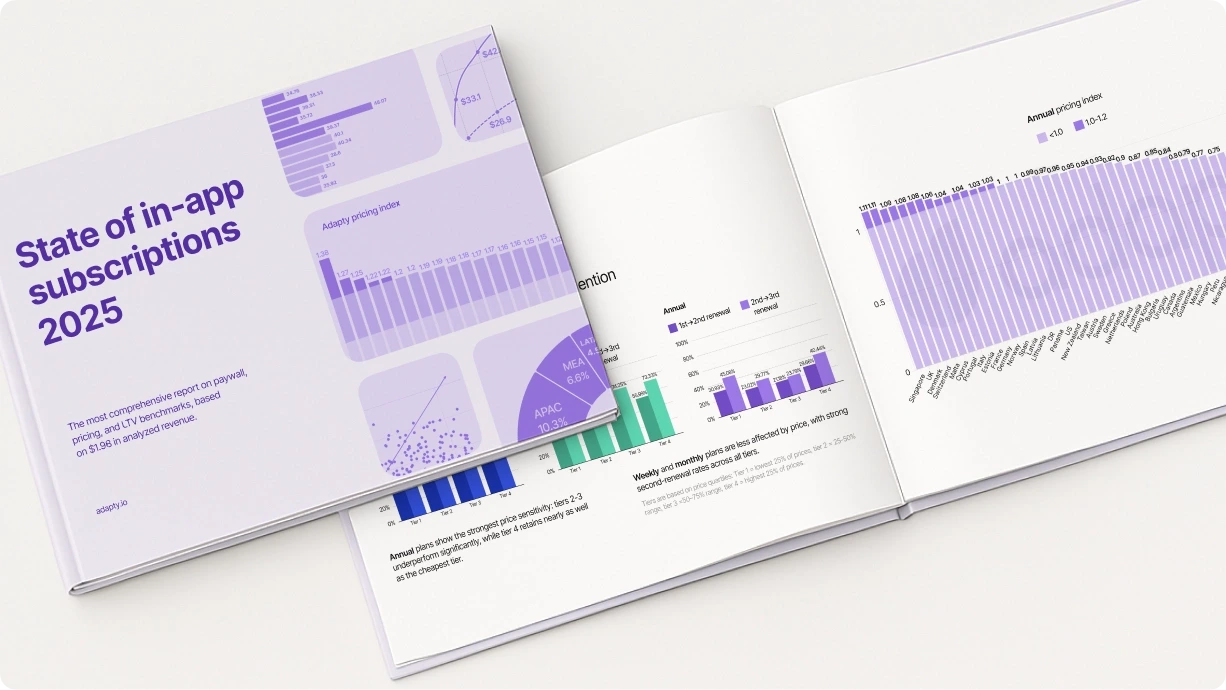
Includes the exclusive Adapty Pricing Index, insights you won’t find anywhere else.
11,000+ apps’ data, distilled into growth moves you can copy today
$1.9B
subscription revenue
$1.7B
users
73K
real-world paywalls
Designed to make every decision easier and faster
Adapty pricing index
See where revenue comes from by region and plan to prioritize what converts best.

Weekly subscription pricing index:$$$$
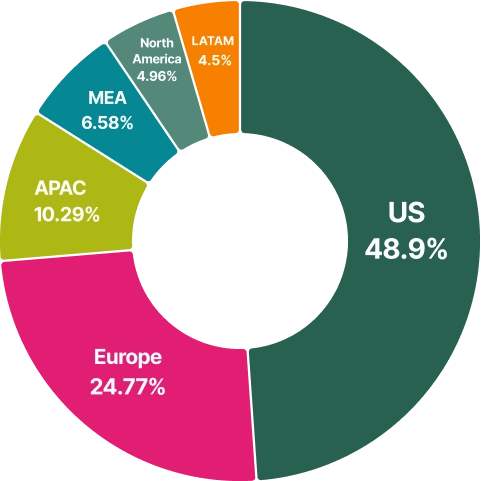
Subscription market breakdown
Compare revenue share across regions and plan types to prioritize what converts where.
Subscription revenue share by region
Conversion benchmarks
Spot funnel drop-offs by plan, price, and trial — and fix what’s slowing users down.
Conversion funnel in the US by renewal stage

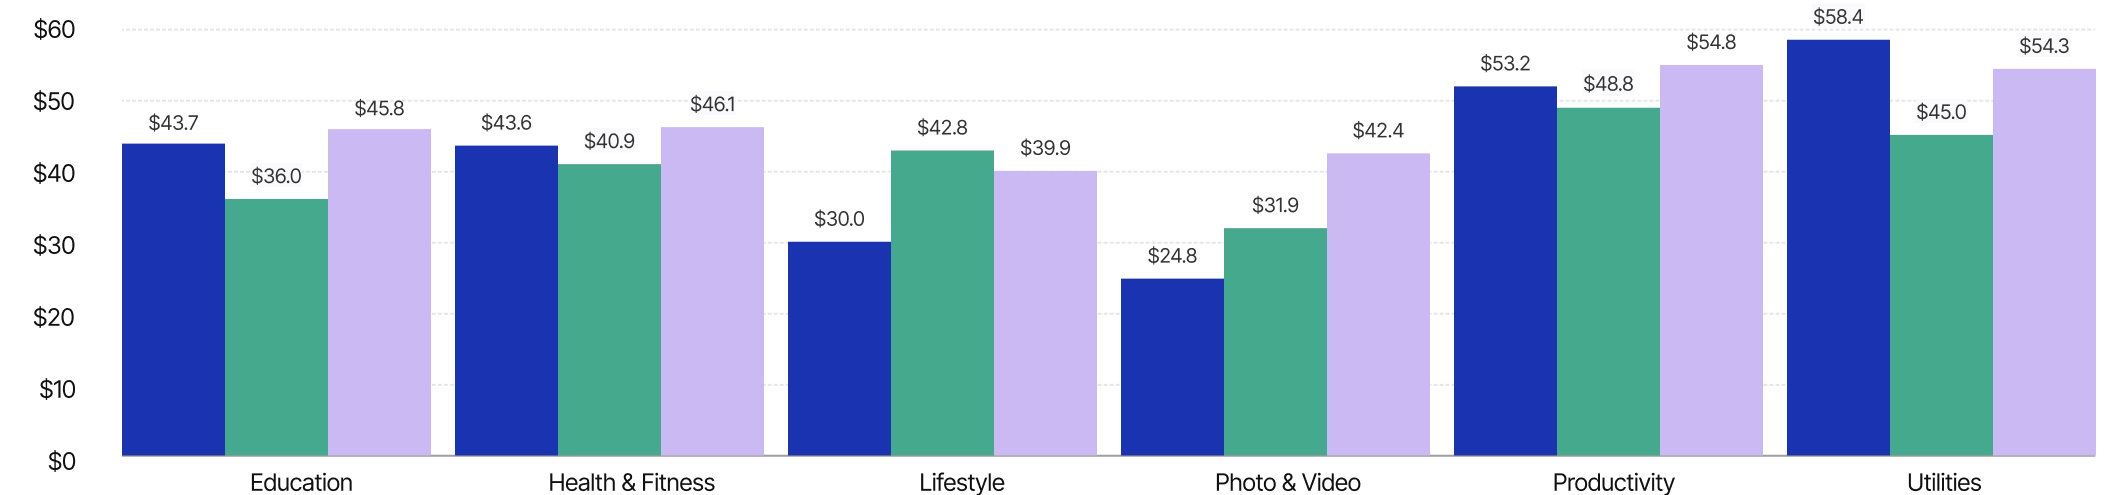
LTV & profitability
Find the most profitable plans by region, price, and trial to monetize smarter.
12-month customer LTV by subscription duration and category
Weekly
Monthly
Annual
Retention and renewals
Explore how trials and plan types impact retention — and focus on what drives renewals.
User retention over time by subscription type
Annual
Monthly
Weekly

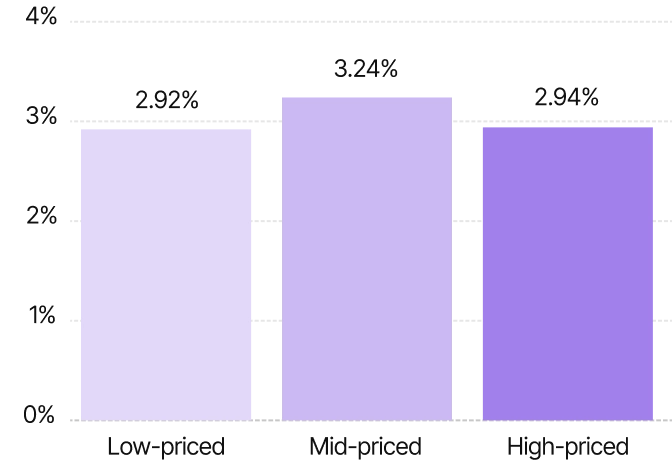
Refund trends
Break down refund rates by price and plan to reduce churn before it spikes.
Refund rates by price tier
A/B experiments and paywalls
Discover which paywalls convert best, what drives uplift, and how testing impacts revenue at scale.
Three-plan paywalls (weekly, monthly, yearly) deliver the highest LTV.
Simple weekly plans with short trials convert best.
Annual + weekly combos create a clear upgrade path.
Your next growth decision starts with better data
For teams making pricing, paywall, and monetization decisions today.
Download the report